Current ICAP Momentum/Trend Model (MOTR) Signal: POSITIVE (Day Count = 1)
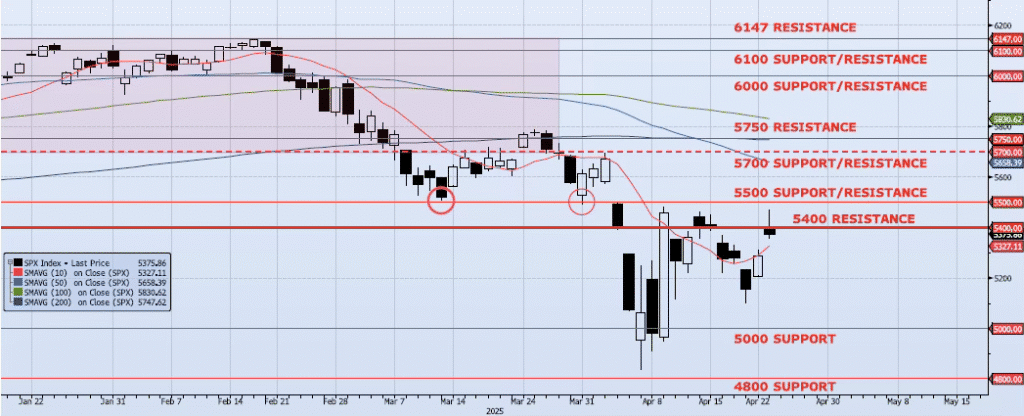
The SPX index gained 1.67% on the session, closing at 5375. While this move was impressive, the close did come well off the day’s high (ref 5469) and below the previously highlighted resistance level at 5400. That said, momentum and trend indicators have reversed to some degree and show signs of improvement. Spot VIX and VIX term structure signals remain conflicted. The ICAP Momentum/Trend (MOTR) Model signal shifted to Positive. As I wrote yesterday with the index at 5287, “if the index can follow through and clear the 5300 level there may be some additional upside back to the 5400/5500 range.” The index is indeed acting as expected but the 5400 level needs to be taken out relatively quickly. Consolidation above this level could be constructive, but hesitation below would be very bearish in my opinion. Overall, I remain respectful of the potential speed and magnitude of these counter trend rallies. Although the MOTR signal is now Positive, I am not participating in any upside exposure. Remember, my model is not a “black box”. It is a rule-based portfolio management system. I will never trade against a signal, but I am not forced to trade with one either if I do not care for the overall set up. To note, I said the same thing back in mid-February at all-time highs (that worked out well). I remain confident that the near-term downside targets of 5000 and 4800 will be achieved. I continue to believe that my intermediate/longer term downside targets of 4200 and 3700 will be achieved before the current cycle ends
Trade Support:
5000: ~20% Move Peak-to-Trough
4800: Dec 2021/Jan 2022 High
4200: ~50% Retracement Mar 2020 Low to Feb 2025 High
3700: ~Nov 2022 Low and 61.8% Retracement Mar 2020 Low to Feb 2025 High
Trade Resistance:
5400: Sep 2024 Lows and Apr 3 Low/Close (BROKEN AND FAILED)
5500: ~10% Move Peak-to-Trough
5658: 50dma
5700: Previous Support Sep/Nov
5750: 38.2% Retracement Peak-to-Trough
6000: Previous Support