Current ICAP Momentum/Trend Model Signal: POSITIVE (Day Count = 6)
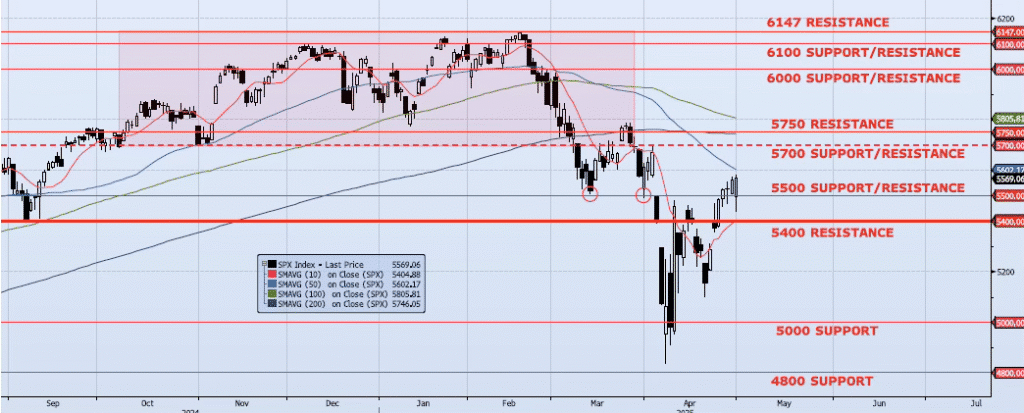
The SPX index gained 15bps yesterday, closing at 5569. What’s much more impressive than that is the index closing +2.50% above the early session low of 5433. The last trading day of April was emblematic of a month which saw a peak-to-trough drawdown of ~15% in just three days followed by a trough-to-peak rally of ~15% over the following three weeks. Momentum and trend continued to confirm this counter trend rally for the short term, but their magnitude of expansion is compressing (not a huge deal at the moment). My Spot VIX model signal remains “risk on” and VIX term structure remains neutral. The ICAP Momentum/Trend Model signal remains Positive. All in, as I have written over the past few days, “I continue to believe that this counter trend rally could test 5700.” Although the current move higher has been impressive, I am not chasing. I continue to see the greater risk as skewed to the downside and am managing the S&P 500 exposure in the portfolio short/flat with no long exposure until the intermediate and long-term signals shift from the current Negative reading.
Trade Support:
5000: ~20% Move Peak-to-Trough
4800: Dec 2021/Jan 2022 High
4200: ~50% Retracement Mar 2020 Low to Feb 2025 High
3700: ~Nov 2022 Low and 61.8% Retracement Mar 2020 Low to Feb 2025 High
Trade Resistance:
5400: Sep 2024 Lows and Apr 3 Low/Close (BROKEN)
5500: ~10% Move Peak-to-Trough (BROKEN)
5602: 50dma
5700: Previous Support Sep/Nov
5750: 38.2% Retracement Peak-to-Trough
6000: Previous Support