Current ACAP Momentum/Trend Model Signal: NEGATIVE (Day Count = 7)
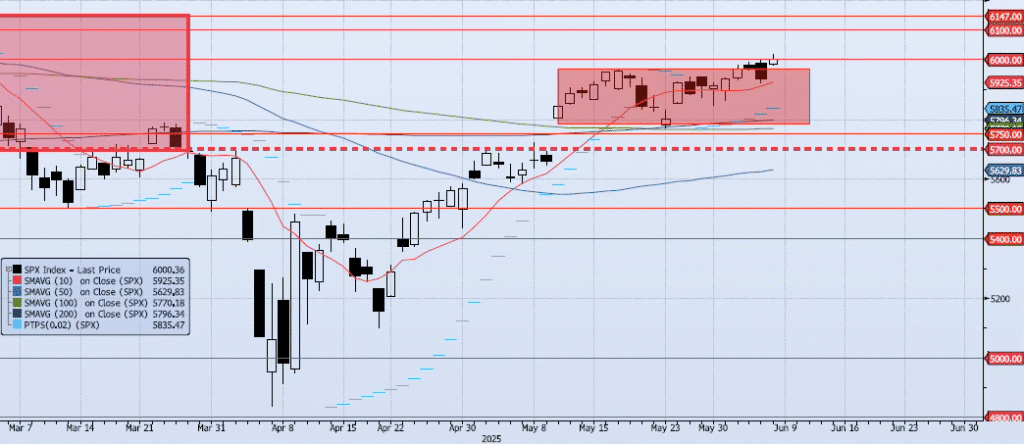
The SPX index was able to break above 6000 on an intraday basis during Friday’s session, hitting a high of 6016, but faded into the close, ending the session up 1.03% at 6000.36. As the index continues to test resistance at 6000, internals are divergent to flat. Momentum and trend indicators are flat to negative. My Spot VIX and VIX Term structure signals are “risk on”. The ACAP Momentum/Trend Model signal remains Negative. I am watching for a breakout above 6000 with a shift in the ACAP signal, but I currently see risk as skewed to the downside. As I wrote heading into Friday’s session, “I removed all SPX exposure, waiting for a more uniform signal/trade. The 6k level is solid resistance, SOLD TO YOU!!.”
Trade Support:
5750: 38.2% Retracement Peak-to-Trough
5700: Previous Support Sep/Nov
5500: ~10% Move Peak-to-Trough
5400: Sep 2024 Lows and Apr 3 Low/Close
Trade Resistance:
6000: Previous Support
6100: Previous Support
6147: All-Time High