Daily Technical Analysis
Market ReportMarket Summary
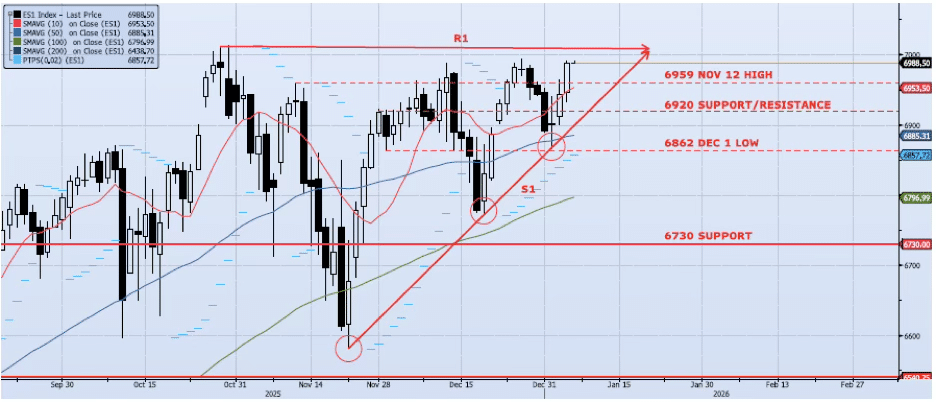
The ES1 Index (Generic 1st Month S&P 500 E-mini) gained 63bps during yesterday’s session, closing at 6987. After some early session chop, the index gained its footing and ran back above the 10dma (ref 6947) and the previously identified resistance level at 6959. Momentum and trend indicators expanded, confirming the upside price action. My VIX signals are neutral/risk on. As I have continued to write, the Jan 2 hold at support line S1 (see chart) was significant and set up for a run at the 7000 resistance level. This level is the top of what I see as an ascending triangle (see chart) and, I believe, will not hold. I fully expect an illogical breakout above 7000 and a run to the 7200/7400 range in the intermediate term. All that said, S1 must hold even through any remaining price volatility.
Support Levels
- 6959: Nov 12 High
- 6920: Near-Term Resistance (Nov 28 – Dec 4)
- 6885: 50dma
- 6730: Previous Support/Resistance
- 6796: 100dma
- 6540: Oct 10 Low (Crucial Support)
Resistance Levels
- 7013: All-Time High (Oct 30)
- 7200: Measure Move
Technical Chart
Risk Disclaimer: Past performance is not indicative of future results. Trading and investing in commodity interests involves substantial risk of loss. All trading decisions should be made in consultation with a qualified financial advisor.