Daily Technical Analysis
Market ReportMarket Summary
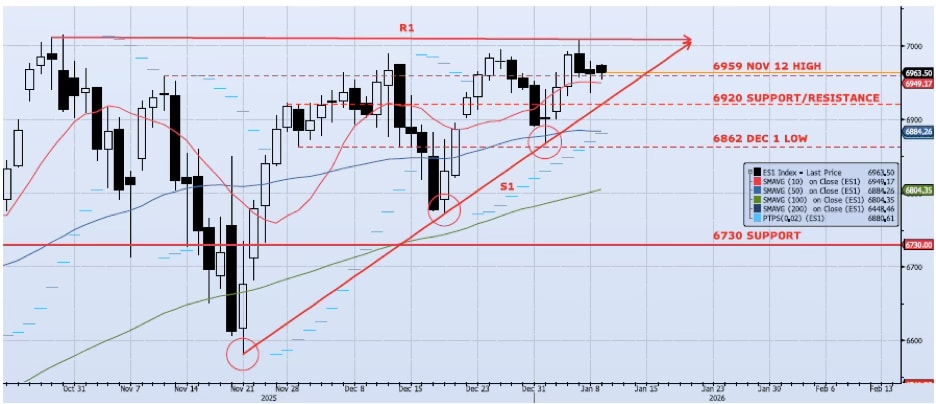
The ES1 Index (Generic 1st Month S&P 500 E-mini) lost a modest 2bps during yesterday’s session, closing at 6962. The session was once again choppy, with a high/low spread of 42 handles. My VIX signals are neutral/risk on. However, Spot VIX and the front-month contracts (UXF6) seem to have a bid beneath them (something to watch). The index low of 6935 held well above the 6920 and S1 support levels (see chart). The close (ref 6962) marked above the highlighted 6959 level. I continue to believe that, despite clear risks, the index is poised to break out above resistance at 7000 and make a move to the 7100/7200 range in the near term. That said, S1 support must hold even through any remaining price volatility.
Support Levels
- 6959: Nov 12 High
- 6920: Near-Term Resistance (Nov 28 – Dec 4)
- 6884: 50dma
- 6730: Previous Support/Resistance
- 6804: 100dma
- 6540: Oct 10 Low (Crucial Support)
Resistance Levels
- 7013: All-Time High (Oct 30)
- 7200: Measure Move
Technical Chart
Risk Disclaimer: Past performance is not indicative of future results. Trading and investing in commodity interests involves substantial risk of loss. All trading decisions should be made in consultation with a qualified financial advisor.