Daily Technical Analysis
Market ReportMarket Summary
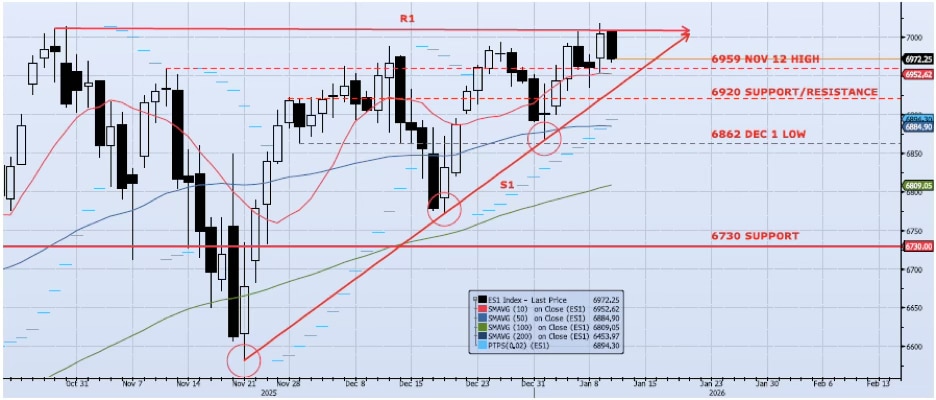
The ES1 Index (Generic 1st Month S&P 500 E-mini) gained 62bps during Friday’s session, hitting a new all-time high of 7017 and a new all-time closing high of 7005 (first close above 7k). There was some early, aggressive price action but the index rallied into the afternoon as momentum and trend indicators expanded. The index low (ref 6954) tested and held the 10dma (ref 6953). Overall, the index continues to work out of the ascending triangle (see chart) as resistance at 7000 starts to break down. Price volatility is brutal, but I continue to see risk skewed to the upside with a breakout above 7000 likely and a test of the 7100/7200 range likely in the near term. As I continue to write, “S1 support must hold even through any remaining price volatility.” I need to stress how irrational I believe price action is currently and how difficult it is for me to be bullish here. That said, I need to be objective and trade the market I have, not the market I want. Note: The AscalonVI Capital portfolio holds positions in a well-diversified basket of assets. I focus the daily note on the S&P 500 only to provide a solid, top-down view of the US equity market. If there is any interest in learning more about the ACAP fund please feel free to reach out at Anthony.Esposito@AscalonVICapital.com.
Support Levels
- 6959: Nov 12 High
- 6920: Near-Term Resistance (Nov 28 – Dec 4)
- 6884: 50dma
- 6730: Previous Support/Resistance
- 6809: 100dma
- 6540: Oct 10 Low (Crucial Support)
Resistance Levels
- 7013: All-Time High (Oct 30)
- 7200: Measure Move
Technical Chart
Risk Disclaimer: Past performance is not indicative of future results. Trading and investing in commodity interests involves substantial risk of loss. All trading decisions should be made in consultation with a qualified financial advisor.