Daily Technical Analysis
Market ReportMarket Summary
The ES1 Index (Generic 1st Month S&P 500 E-mini) lost 21bps during yesterday’s session, closing at 7001. After the index hit a pre-cash session, new all-time high of 7036.25, buyers stepped aside and a volatile churn ensued in the 7010/6990 range. Spot VIX hit a high of 16.50 late in the session as VIX term structure moved slightly towards a “neutral” stance from “risk on”. All said, I am seeing signs that the breakout above 7000 is losing steam. This doesn’t mean that the index will not achieve the upside target of 7100/7200, it just means that it may take a bit longer than previously expected. I see risk as even under the current set up.
Support Levels
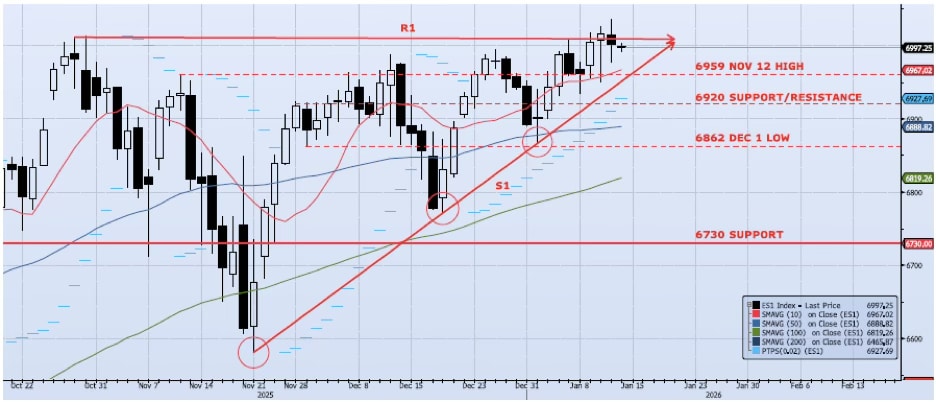
- 6959: Nov 12 High
- 6920: Near-Term Resistance (Nov 28 – Dec 4)
- 6888: 50dma
Resistance Levels
- 7036: All-Time High (Jan 13)
- 7200: Measure Move
Technical Chart
Risk Disclaimer: Past performance is not indicative of future results. Trading and investing in commodity interests involves substantial risk of loss. All trading decisions should be made in consultation with a qualified financial advisor.