Daily Technical Analysis
Market ReportMarket Summary
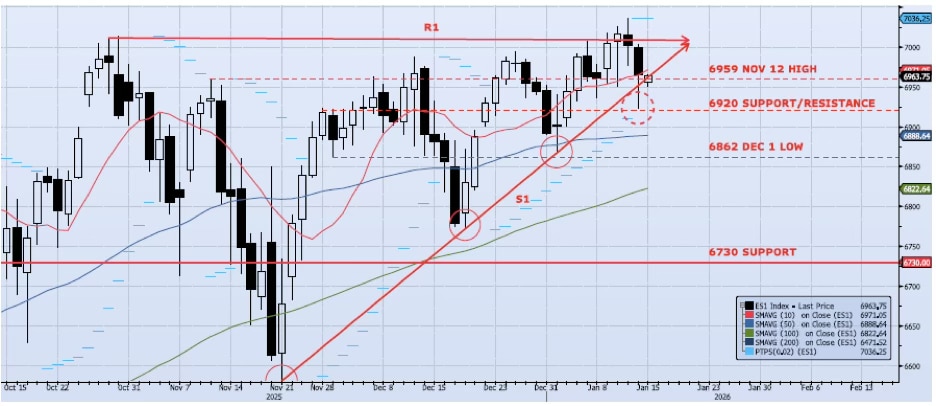
The ES1 Index (Generic 1st Month S&P 500 E-mini) lost 51bps yesterday, closing at 6966. The index hit a low of 6923, slicing below the 6959 support line and coming within three handles of our previously identified downside support level at 6920 (see chart). In doing so, the index broke below the S1 support line on an intra-day basis. Spot VIX broke above the 18 level early in the session, hitting a high of 18.10 and closing at 16.75 as the index recovered from the session low. As I wrote yesterday, “I am seeing signs that the breakout above 7000 is losing steam. This doesn’t mean that the index will not achieve the upside target of 7100/7200, it just means that it may take a bit longer than previously expected. I see risk as even under the current set up.” I stand by this call but now see risk as skewed to the downside. The S1 support line was key to the recent ascending triangle which I have been working off. If the index does not recover quickly and hold back above this line, I would expect downside targets of 6900 and 6862 to get tested in the near term.
Support Levels
- 6959: Nov 12 High
- 6920: Near-Term Resistance (Nov 28 – Dec 4)
- 6888: 50dma
Resistance Levels
- 7036: All-Time High (Jan 13)
- 7200: Measure Move
Technical Chart
Risk Disclaimer: Past performance is not indicative of future results. Trading and investing in commodity interests involves substantial risk of loss. All trading decisions should be made in consultation with a qualified financial advisor.