Current ICAP Momentum/Trend Model (MOTR) Signal: NEGATIVE (Day Count = 6)
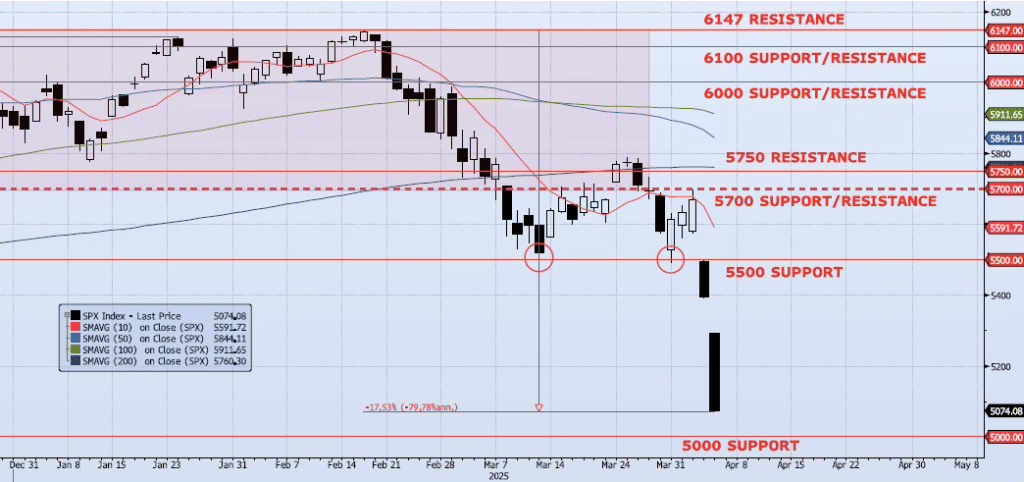
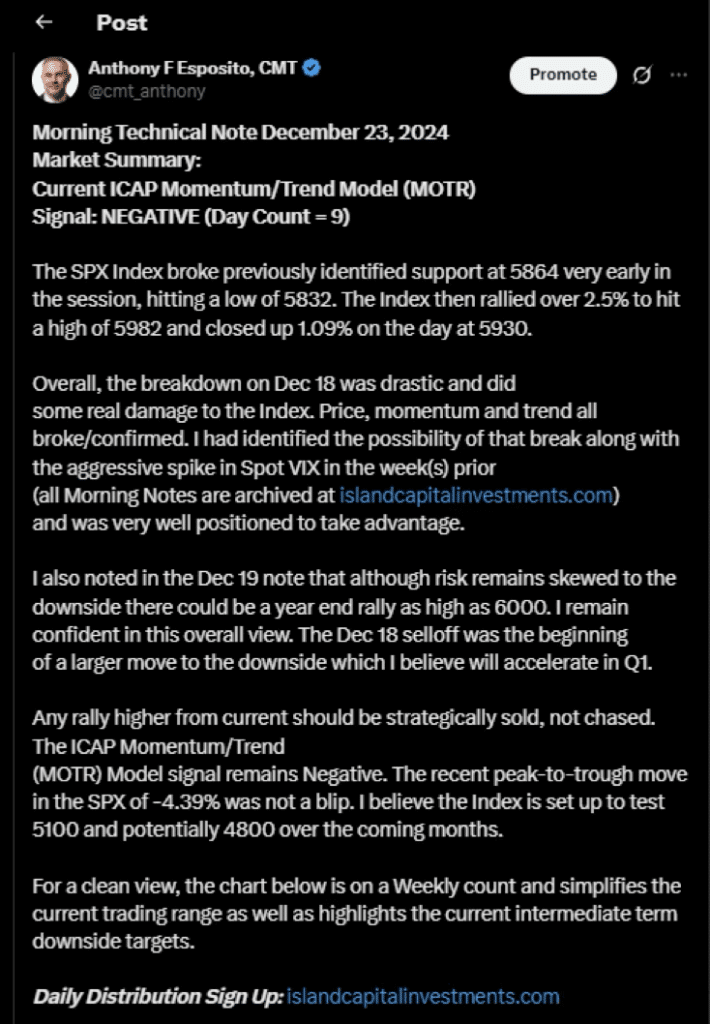
The SPX index fell an additional 5.97% on Friday as the sell-off accelerated. The peak-to-trough move is now down over 17% from the Feb 19 all-time high of 6147. Momentum and trend indicators continue to degrade as Spot VIX and VIX term structure scream “risk off”. The ICAP Momentum/Trend (MOTR) Model signal remains Negative. My chart has not changed, my model has not changed, and my view has not changed since December (my X post from December 23rd below). While I am frustrated with all the late comers now feeling bearish, I find some comfort in the fact that anyone capable of critical thinking can see that they are truly “dumb money” and hide behind the herd and coordinated headlines and narratives. All that said, I remain very confident in my minimum downside target of 5000. I do believe we could see some counter trend bounce off that level but, as I have been saying since December, all rallies for the near term are to be sold, not chased. Below the 5000 level I see additional targets of 4800, 4200 and 3700 (see below). It is my opinion that we will see 3700 before this bear market is complete. This will be a process as it always is. As a reminder, the 2007/2009 bear market was a 57% drawdown which saw five countertrend rallies of between 5% and 30%. This time will be no different.
Trade Support:
5700: Previous Support Sep/Nov (BROKEN)
5500: ~10% Move Peak-to-Trough (BROKEN)
5000: ~20% Move Peak-to-Trough
4800: Dec 2021/Jan 2022 High
4200: ~50% Retracement Mar 2020 Low to Feb 2025 High
3700: ~Nov 2022 Low and 61.8% Retracement Mar 2020 Low to Feb 2025 High
Trade Resistance:
5750: 38.2% Retracement Peak-to-Trough
5878: 50dma
6000: Previous Support
6100: Previous Resistance
6147: All-Time High