Current ACAP Momentum/Trend Model Signal: NEGATIVE (Day Count = 1)
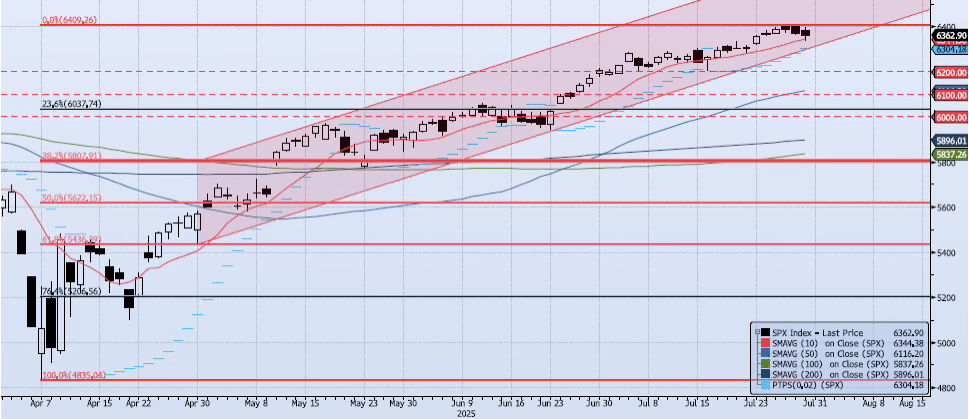
The SPX index lost 12bps on the session yesterday, closing at 6362. The 10dma (ref 6344) was broken on an intra-day basis as the index hit a low of 6336 but held for the close. The session overall was weak with a lower low and lower high versus the previous session. My momentum and trend indictors continue to struggle. The ACAP Momentum/Trend Model signal shifted back to Negative. There is obvious churn within the model, setting up for a powerful move off current levels. Risk is slightly skewed to the downside as the index’s inability to break out above 6400 remains an issue.
Trade Support:
6200: July 7 Low
6147: Previous All-Time High (Feb 19)
6100: Previous Support
6000: Previous Support
Trade Resistance:
6284: All-Time High (Jul 3) (BROKEN)
6390: Fibonacci Projection (Aug ’22 Low to Feb ’24 High) (TESTED)
6400: July 28 All-Time High (TESTED)