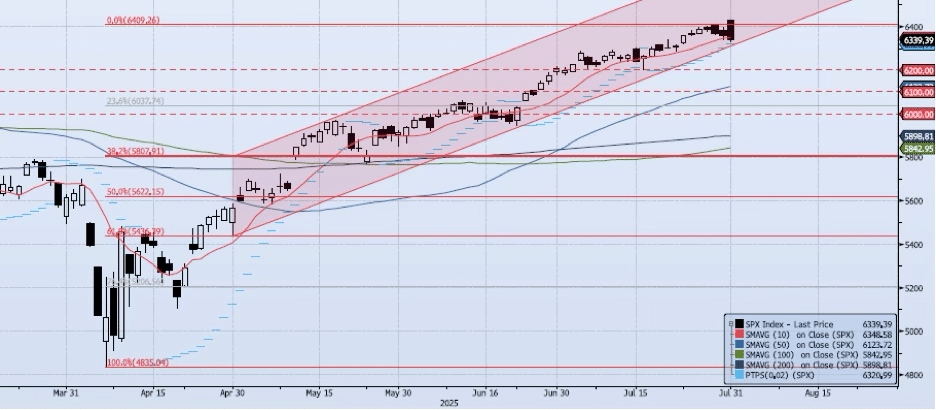
Current ACAP Momentum/Trend Model Signal: NEGATIVE (Day Count = 2)
The SPX index lost 37bps on the session, closing at 6339. What’s much more interesting about the price action was that the index opened exactly at the high (ref 6427.02) and faded for the balance of the session. Additionally, the index gave up the 6400 level once again as it marked a peak-to-trough intra-day move of -1.61%. So, the cash session opens on the high, fades as much as 1.61% and can’t hold what is becoming a major near term resistance level at 6400. This negative price action occurred as momentum and trend indicators faded further. The ACAP Momentum/Trend Model signal remains Negative. Risk remains skewed to the downside as 6400 establishes itself as firm resistance.
Trade Support:
6200: July 7 Low
6147: Previous All-Time High (Feb 19)
6100: Previous Support
6000: Previous Support
Trade Resistance:
6284: All-Time High (Jul 3) (BROKEN)
6390: Fibonacci Projection (Aug ’22 Low to Feb ’24 High) (TESTED)
6400: July 28 All-Time High (TESTED)


