Current ACAP Momentum/Trend Model Signal: POSITIVE (Day Count = 3)
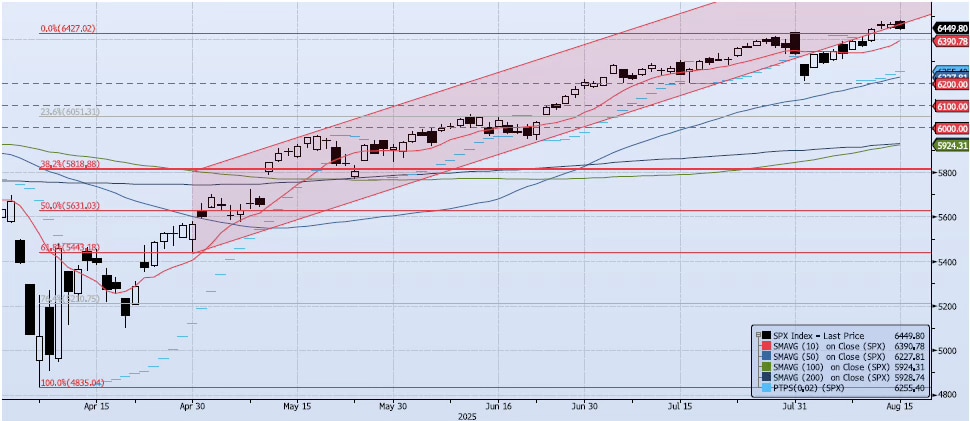
The SPX index lost 29bps during Friday’s session, closing at 6449. This closing price is somewhat concerning as it was a break back below the support line of the highlighted uptrend channel (see chart). My momentum and trend indicators held firm. My Spot VIX signal is “risk on”. VIX Term Structure is “risk on” as well. The ACAP Momentum/Trend Model signal is Positive. As mentioned above, the index breakdown and close below the uptrend channel is concerning, but I would keep it in perspective. Near-term risk remains skewed to the upside with 6600 as a realistic target. However, my view would change if the index were to break below 6400 with a confirming ACAP model shift to Negative.
Trade Support:
6200: July 7 Low
6147: Previous All-Time High (Feb 19)
6100: Previous Support
6000: Previous Support
Trade Resistance:
6284: All-Time High (Jul 3) (BROKEN)
6390: Fibonacci Projection (Aug ’22 Low to Feb ’24 High) (BROKEN)
6400: July 28 All-Time High (BROKEN)
6600: Mid-Point of Uptrend Channel