Daily Technical Analysis
Market ReportMarket Summary
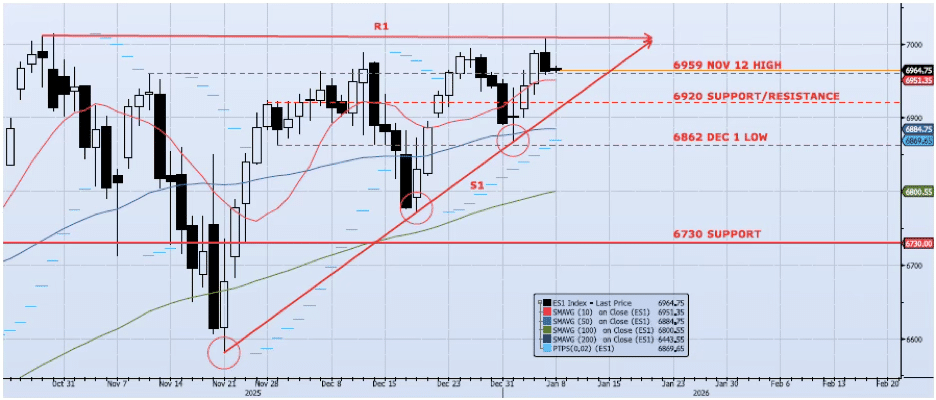
The ES1 Index (Generic 1st Month S&P 500 E-mini) lost 35bps yesterday, closing at 6963. The index made an early run at the 7000 resistance level, hitting a high of 7006, then faded back to the previously identified support level at 6959, hitting a low of 6958. Price action was volatile, but momentum and trend indicators improved on balance. My VIX signals are neutral/risk on. However, Spot VIX is picking its head up and front-month contracts (UXF6) seem to have a bid beneath them. All in, I remain bullish as long as the index is above the S1 support line. I believe the index will catch a bid and run through 7000 in the near term. That said, underlying action in the VIX is concerning and if the index breaks below S1, all bets are off. As I wrote yesterday, “S1 must hold even through any remaining price volatility.”
Support Levels
- 6959: Nov 12 High
- 6920: Near-Term Resistance (Nov 28 – Dec 4)
- 6884: 50dma
- 6730: Previous Support/Resistance
- 6800: 100dma
- 6540: Oct 10 Low (Crucial Support)
Resistance Levels
- 7013: All-Time High (Oct 30)
- 7200: Measure Move
Technical Chart
Risk Disclaimer: Past performance is not indicative of future results. Trading and investing in commodity interests involves substantial risk of loss. All trading decisions should be made in consultation with a qualified financial advisor.