Daily Technical Analysis
Market ReportMarket Summary
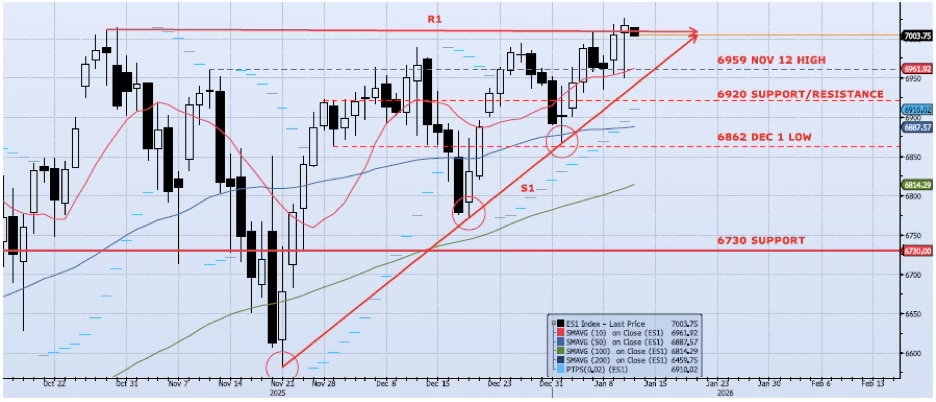
The ES1 Index (Generic 1st Month S&P 500 E-mini) gained a modest 16bps yesterday, closing at a new all-time high of 7016. Despite this small day over day move, the index was extremely volatile during both the overnight and cash session. The high/low spread was 7025(ATH)/6950, 75 handles, or 1.07%. After hitting the 6950 low around 3:00AM ET (London open) the index firmed up and grinded higher with expanding internals. Spot VIX gapped up ~15% on the open, ticking at a high of 16.66 but faded ~10% to close at 15.12. All said, the index continues to push above resistance at 7000. As I wrote yesterday,” the index continues to work out of the ascending triangle (see chart) as resistance at 7000 starts to break down. Price volatility is brutal, but I continue to see risk skewed to the upside with a breakout above 7000 likely and a test of the 7100/7200 range likely in the near term.”
Support Levels
- 6959: Nov 12 High
- 6920: Near-Term Resistance (Nov 28 – Dec 4)
- 6887: 50dma
- 6730: Previous Support/Resistance
- 6814: 100dma
- 6540: Oct 10 Low (Crucial Support)
Resistance Levels
- 7025: All-Time High (Jan 12)
- 7200: Measure Move
Technical Chart
Risk Disclaimer: Past performance is not indicative of future results. Trading and investing in commodity interests involves substantial risk of loss. All trading decisions should be made in consultation with a qualified financial advisor.